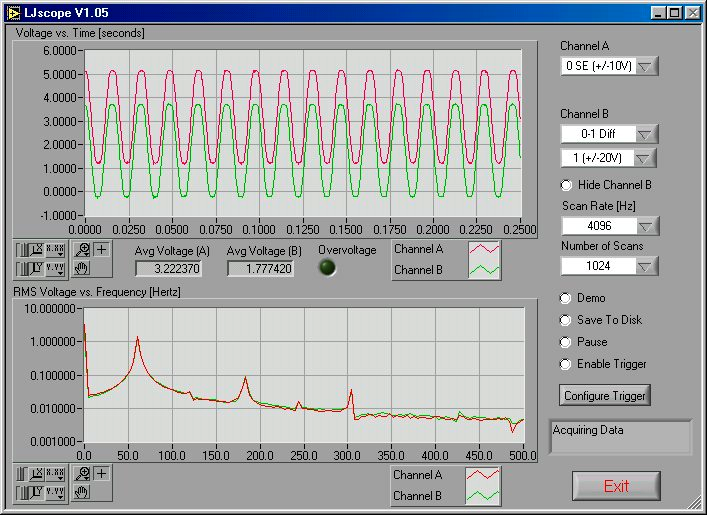
LJscope simulates an oscilloscope by reading data from 2 analog input channels in burst mode.
 Figure 3.5-1. LJscope
There are two graphs on the LJscope main window (Figure 3.5-1), which show voltage versus time and voltage versus frequency. Both graphs have a palette to control various features such as autoscaling and zooming:

-
When you press this button it locks button 3 on (autoscale) position.
-
When you press this button it locks button 4 on (autoscale) position.
-
Pressing this button autoscales the x-axis.
-
Pressing this button autoscales the y-axis.
-
Miscellaneous x-axis formatting options.
-
Miscellaneous y-axis formatting options.
-
Zooming tool. Press this button to see different options for zooming. When collecting data, zooming will not work well unless autoscaling is off.
-
Panning tool. Allows you to drag and scroll around the graph.
-
Not applicable.
Other LJscope controls include:
-
Channel A/B: Select the two AI channels that will be acquired. If a differential channel, is selected, the gain selection control will appear.
-
Hide Channel B: When selected channel B will not be shown on the graph.
-
Scan Rate [Hz]: (256 to 4096) Determines the scans/second for both channels.
-
Number of Scans: (32 to 2048) Determines the number of scans that will be collected, and thus the total acquisition period. For example, if 1024 scans are collected at 4096 Hz, a quarter second of data will be collected (as shown in Figure 3-10).
-
Demo: Calls “AIBurst” in demo mode so timing and data is simulated.
-
Save To Disk: If selected a prompt will appear for a filename, and the current burst of data is saved to a tab-delimited file (time, channel A, channel B).
-
Pause: Pauses data acquisition.
-
Enable Trigger: Enables the IO trigger.
-
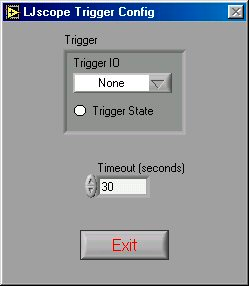
Configure Trigger: Brings up the window shown in Figure 3.5-2. Choose the IO line to trigger on and whether to trigger when it is high or low. Also set the timeout period so the application will continue (with an error) if the trigger is not detected.
 Figure 3.5-2. Configure Trigger
