Define Tags, Groups, Ranges, and Alarms
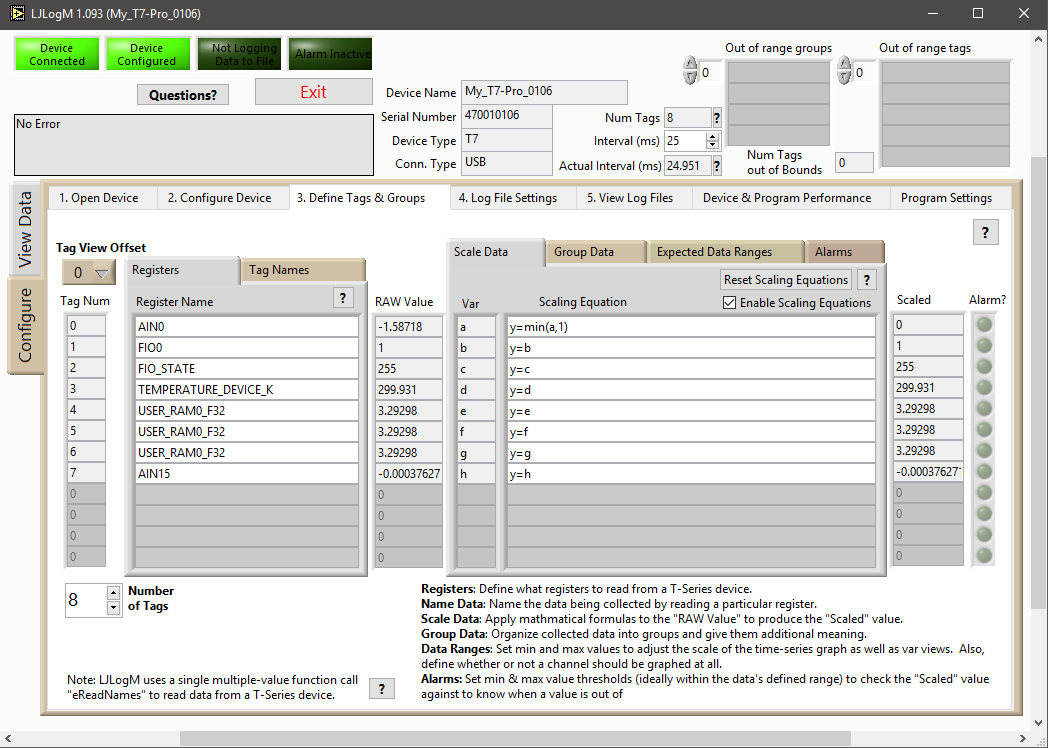
To facilitate collecting data from more than 16 channels at a time and providing a method of viewing all data being collected, LJLogM uses the terminology "Tags" and "Groups". Tags consist of a register and a human-readable name as well as any other relevant configuration. Tags can be organized into 10 different Groups which can be viewed one at a time on each of the data view pages. This is especially useful for customers looking to collect data from a T7 paired with a Mux80 which provides 84 single-ended analog inputs. There are several controls on this page, but before continuing, find and understand the following:
Horizontal Page Organization: Depending on what tabs are selected, data for a given Tag is organized horizontally across the page. Starting with Tag Num and finishing with the Scaled and Alarm? indicators. The one exception to this rule is how data Groups are defined and given names.
Number of Tags: This defines how many tags or registers LJLogM is reading from the connected T-Series device. To add a new tag, increment the Number of Tags by one.

Tag View Offset: Sets the first Tag number in the display list of 12 Tags, allowing users to scroll through all enabled Tags.

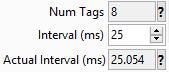
Data Collection Rate: To configure how fast data is collected from a device, look towards the top of the page and find the following controls. The "Interval (ms)" control lets users define how fast LJLogM should attempt to collect data from a device, and the "Actual Interval (ms)" indicator shows how fast data is actually being collected. For more data collection statistics, press the ? button or look at the "Program Performance" section of LJLogM.
Registers: To edit the register being read by LJLogM from the connected T-Series device, edit the following field. The ? button is a shortcut to take users to the Modbus Map page where a list of all the available registers can be found. For example: AIN0, AIN9, EIO2, WIFI_STATUS, DIO0_EF_READ_A_F, or AIN3_EF_READ_A, etc.
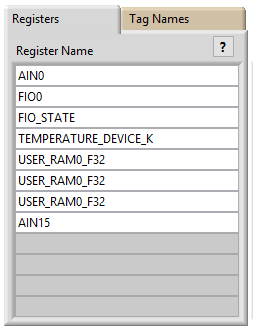
Tag Names: This control allows customers to define the name that gets displayed in all of the data views and what name is saved to the .log file. After editing a register, the associated Tag Name will be automatically changed to become the name of the register. To edit the name of the tag, simply edit the associated field.

RAW Value: After defining a list of valid registers, the RAW Value array will begin updating. These are the values directly from the device before scaling.
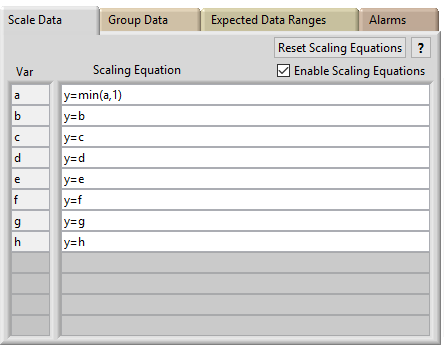
Scaling Equations: This should be something like y=a, where y is the scaled output and a is the raw value of Tag 0. b through p would be Tags 1 to 15, and so on. Everything after // is ignored, so use for comments. A few examples:
y=c                       // Scaled value equal to raw value from 3rd row
y=100*c                   // EI-1034/LM34 voltage to deg F
y=c-273.15                // deg K to deg C
y=((c-273.15)*9/5)+32     // deg K to deg F
y=TCVoltsToTemp[K:c:a]    // Type K, t/c voltage from 3rd row, CJ temp from 1st row
For more details see the LJLog/Stream Scaling Equations page. The defined scaling equations can be reset to default values by pressing the Reset Scaling Equations button. If scaling equations do not need to be applied or the maximum data throughput of LJLogM is being reached, uncheck the Enable Scaling Equations check box.
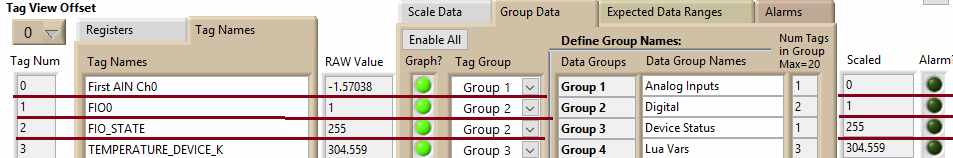
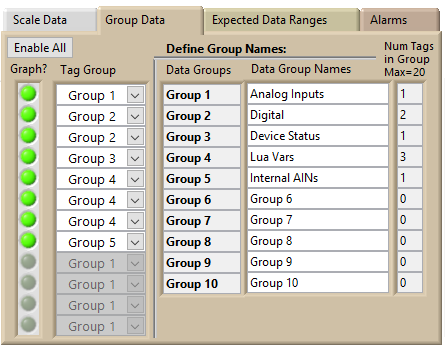
Group Data: After a list of Tags have been defined, they can be organized into Groups so that related data can be graphed together or displayed in the bar views. There are 10 groups that data can be organized into. Groups can be given customized human readable names.
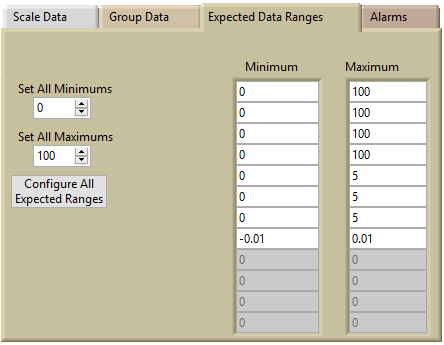
Expected Data Ranges: If the data being read have explicit ranges or if users wish to customize the scales of the various views, edit the expected data ranges for each of the tags. All of the tags have the same ranges, edit the set all minimums and maximums controls and press the Configure All Expected Ranges button.
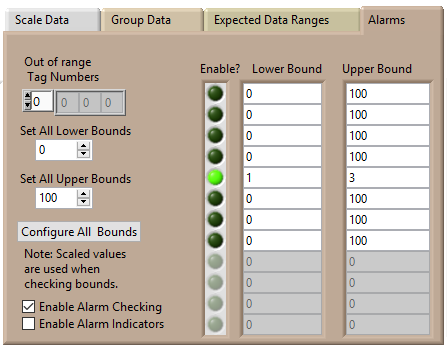
Alarms: Alarms can be configured, enabled, and disabled on a tag-by-tag basis. This tab is where they are edited. If all of the tags need to have the same alarm bounds, edit the Set All Lower Bounds and Set All Upper Bounds controls and press the Configure All Bounds button. Once configured, the Enable? indicator should be pressed to enable the alarm. When enabled it will light up bright green. The Enable Alarm Checking option enables LJLogM to perform the necessary math operations to calculate whether the values are in or out of bounds. The Enable Alarm Indicators option is a final catch-all that enables or disables the GUI from being updated to show the various alarm conditions.