Device and Program Performance
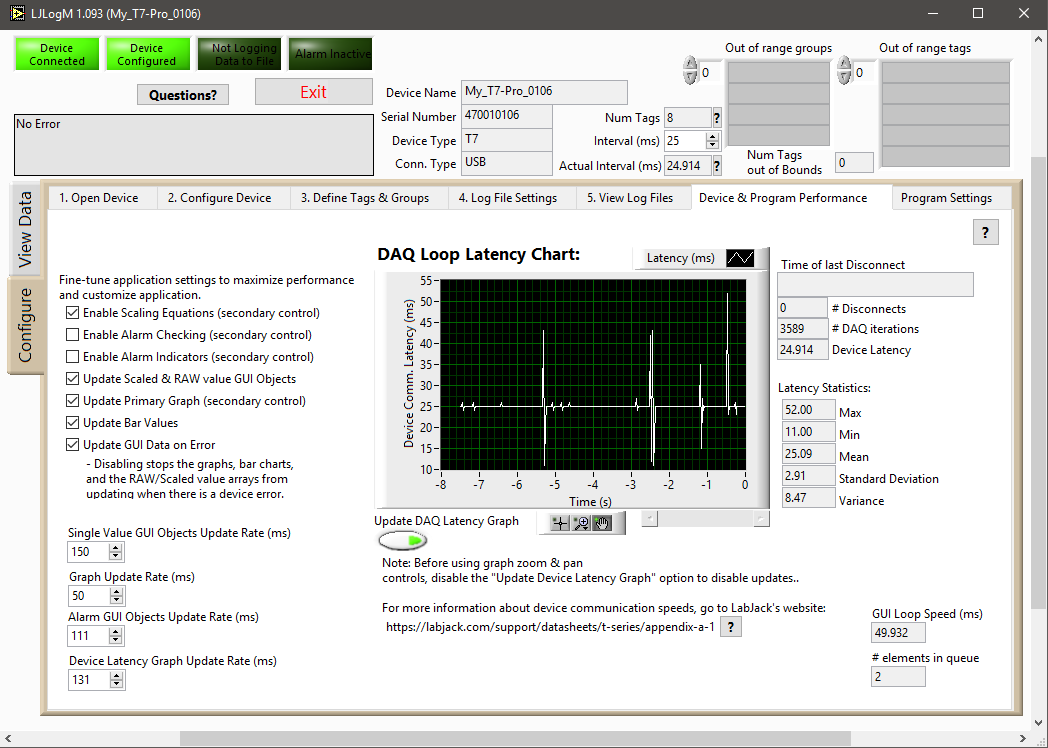
When collecting data from a LabJack at high data rates or trying to collect data at tightly controlled intervals, there are several factors to consider. The active connection type, how many channels are being logged, what type of data is being collected, and what calculations are being ran afterwards are all important. This feature of LJLogM provides a method to detect, diagnose, and understand communication speed issues and limitations.
This section of LJLogM directly correlates to section 3.0 Communication and section A-1 Data Rates of the T-Series datasheet. It is important to understand that the USB, Ethernet, and WiFi communication interfaces of T-Series devices perform differently, where some are inherently less reliable than others. WiFi connections, for example, can easily become temporarily disconnected due to excess network traffic or 2.4Ghz electrical noise in the surrounding environment. To assist with understanding communication interface performance LJLogM includes a chart that keeps track of how regular data is being polled from the connected device and calculates a few statistical metrics.
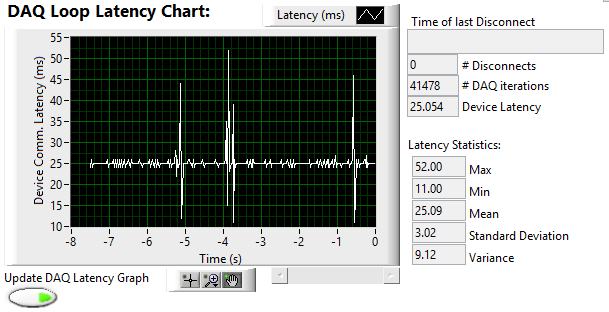
In addition to the communication medium's performance characteristics, users have to remember that Windows is not a real time operating system. For most customers, LJLogM won't be the only application running on the used computer and the CPU or associated memory buses may become seemingly "randomly" busy which can cause additional latency spikes. When trying to collect data as fast as possible (1-10ms intervals), these limitations are sometimes encountered. Therefore, LJLogM includes options to selectively disable a variety of calculations that are performed on the incoming data as well as controls that adjust how often data is rendered to the various graphs and display indicators.
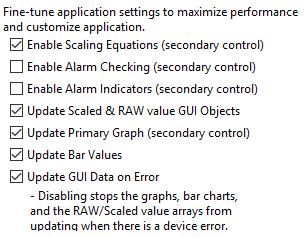
Users can enable or disable some calculations that are performed such as scaling equation and alarm checking from this tab. Users can also choose to disable the updating of indicators to increase data logging performance.
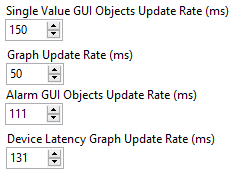
Several of the GUI elements can also have their update rates be individually controlled. Understanding the affects of graph refresh rates is also important if users wish to later design their own logging application starting with the provided example code.