Overview
Achieving the maximum command-response speed requires estimating the approximate average time, then understanding and compensating for worst-case iteration times. To optimize, you may need to measure how long each code segment takes. Different methods of doing command-response include USB, Ethernet, WiFi, and on-board Lua scripts—each has different advantages and disadvantages. See below for real-world benchmarks.
About Command-Response
Communicating one packet at a time with a LabJack using command-response mode is simple, has minimal latency, and allows your code to react to each individual data value before reading or writing the next value (or set of values). For more about command-response:
-
T-series Datasheet - 3.0 Communication
-
U3 Datasheet - 3.0 Operation
-
U6 Datasheet - 3.0 Operation
-
UE9 Datasheet - 3.0 Operation
Command-response is useful especially for feedback. With a T-series device and LJM, you could, for example, read an analog input and set digital outputs in the same packet using the eNames function—this would allow you to output each set of digital outputs according to the analog input from the previous iteration.
For the most consistent timing between samples, use stream mode instead of command-response. Stream mode is hardware-timed and generally used for fast sample collection:
Estimating the Average Iteration Time
To estimate the average iteration time, use the data rates section of the datasheet for your device:
-
T-series Datasheet - A-1 Data Rates
-
U3 Datasheet - 3.1 - Command/Response
-
U6 Datasheet - 3.1 - Command/Response
-
UE9 Datasheet - 3.1 - Command/Response
Each command-response iteration includes the following:
-
Communication time
-
Sampling time
-
Device processing time
-
Host computer processing time
Of these, device and host computer processing time are usually negligible. Communication time will generally take milliseconds or hundreds of microseconds, depending on the connection type. Sampling time takes different amounts of time, depending on what register is being read.
Comparison of Connection Types
There are four ways of communicating with the Modbus server on the LabJack: USB, Ethernet, WiFi, and on-board Lua scripts. On-board Lua scripts are only supported on T-series devices. Ethernet can be directly connected to the host computer (without routing through a network).
If your application requirements do not constrain you to using a specific connection type, consider the options:
USB
-
Communication latency: Low latency and low variability because it doesn't require communication through a network.
-
Packet size: 64-bytes per packet
-
Note: On older x86 chipsets, speeds have been observed to be slower on USB 2.0 ports than USB 3.0 ports despite the fact that LabJack devices use USB 2.0 connectors.
Ethernet - not available on the U3 or U6
-
Communication latency: Latency is limited by the slowest link in the network. Networks that are completely wired will generally have good latency.
-
Packet size: 1040-bytes per packet.
Direct Ethernet - not available on the U3 or U6
-
This is equivalent to using Ethernet through a network, except that communication latency is reduced by directly connecting the host computer's Ethernet port to the Ethernet port of the LabJack device.
WiFi - T7-Pro only
-
Communication latency: Latency is slower compared to an equivalent Ethernet connection because WiFi is inherently slower than Ethernet (due to the potential for radio wave interference).
-
Packet size: 500-byte limit on the packet size.
On-board Lua Scripts - T-series only
-
Communication latency: No communication latency between the Lua script and the on-board Modbus server is incurred.
-
If your Lua script's output needs to be read by a host computer (using USER_RAM), communication latency may be incurred when a host computer reads it, as normal.
-
Packet size: 500-byte limit on the packet size.
For each of the above communication methods, the average and worst case communication latency should be measured for any particular system. See below for example benchmark results for each connection type as well as USB results for Raspberry Pi models.
Avoid Multiple Packets
If multiple packets need to be sent per iteration, the communication overhead increases. For T-series devices, LJM attempts to minimize the number of packets sent by using a custom Modbus functions that allows writes and reads to be done in the same command-response packet pair. It also compresses contiguous operations when it can, to reduce packet size. For details, see Multiple Value Functions.
Iteration Time: Average vs. Worst Case
Even though most iterations will be close to the average iteration time, some iterations may take longer. Reasons include:
-
The processor may have high load.
-
The operating system scheduler may produce delays, even with low processor load.
-
Networks may lose or delay packets.
If consistent time periods between iterations is important, you can use interval timing. Interval-timed loops are still subject to some timing jitter due to differences in communication time for each iteration. For T-series devices with LJM, the StartInterval function is a good place to start.
For T-series devices, on-board Lua scripts offer faster and generally more consistent timing. Lua scripts can still suffer jitter due to processor load.
Alternately, stream mode uses hardware-timed sampling. (See discussion about command-response above.)
Worst Case Examples
To give a feel for how often a loop is slow, and by how much, we performed tests that read one digital input as fast as possible.
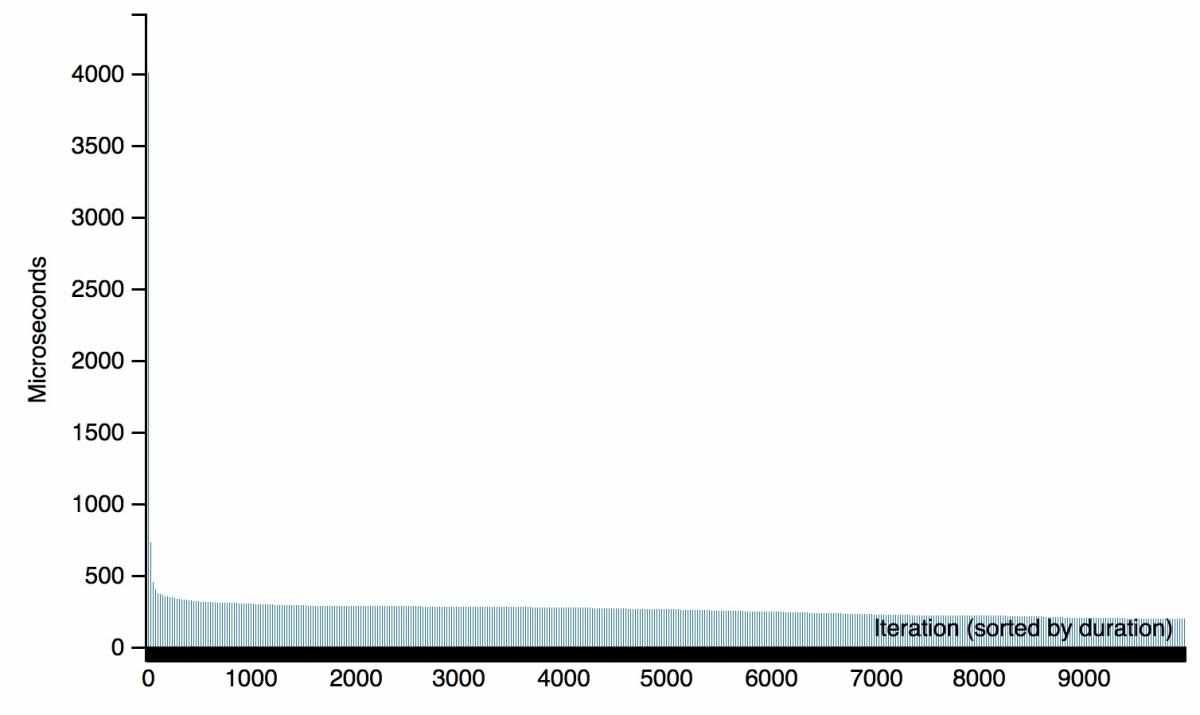
USB 3.0 Port: For 10,000 iterations, with an average iteration of 0.264 ms, the longest 5 iterations were as follows:
-
3.999 ms
-
3.749 ms
-
3.077 ms
-
2.205 ms
-
2.034 ms
Most of the iterations were close to the average. This chart shows how long each iteration took:
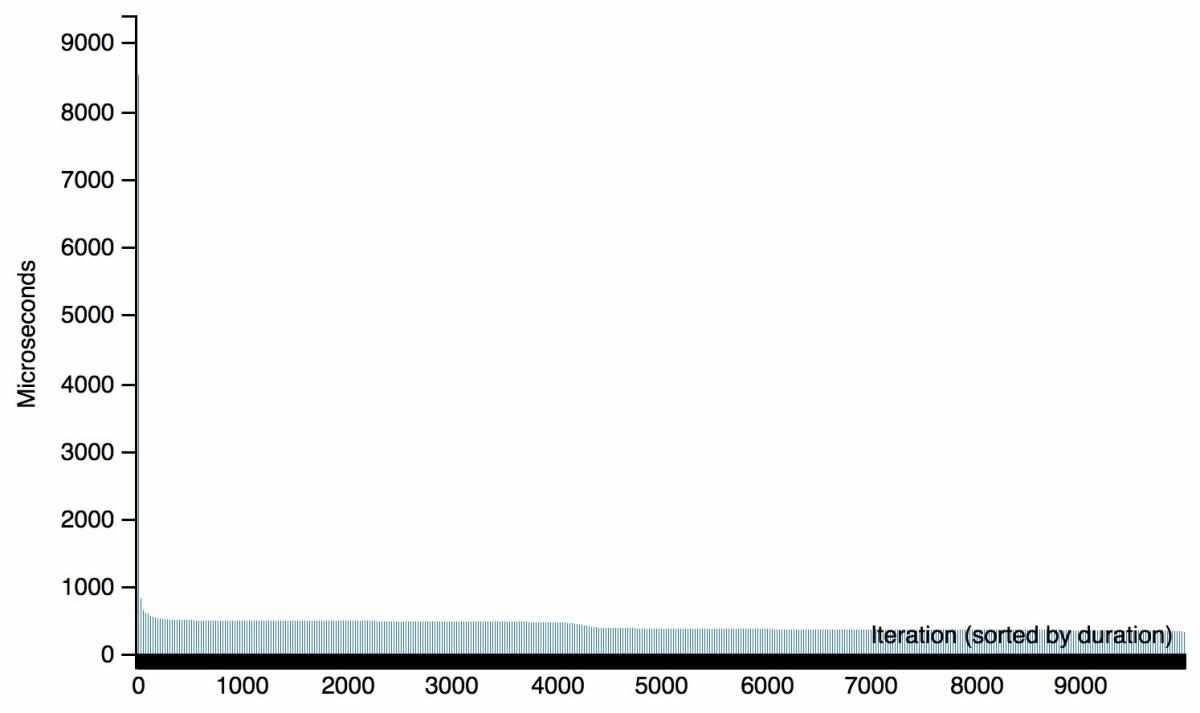
USB 2.0 Port: For 10,000 iterations, with an average iteration of 0.431 ms, the longest 5 iterations were as follows:
-
8.534 ms
-
8.028 ms
-
6.611 ms
-
4.383 ms
-
4.012 ms
Most of the iterations were close to the average. This chart shows how long each iteration took:
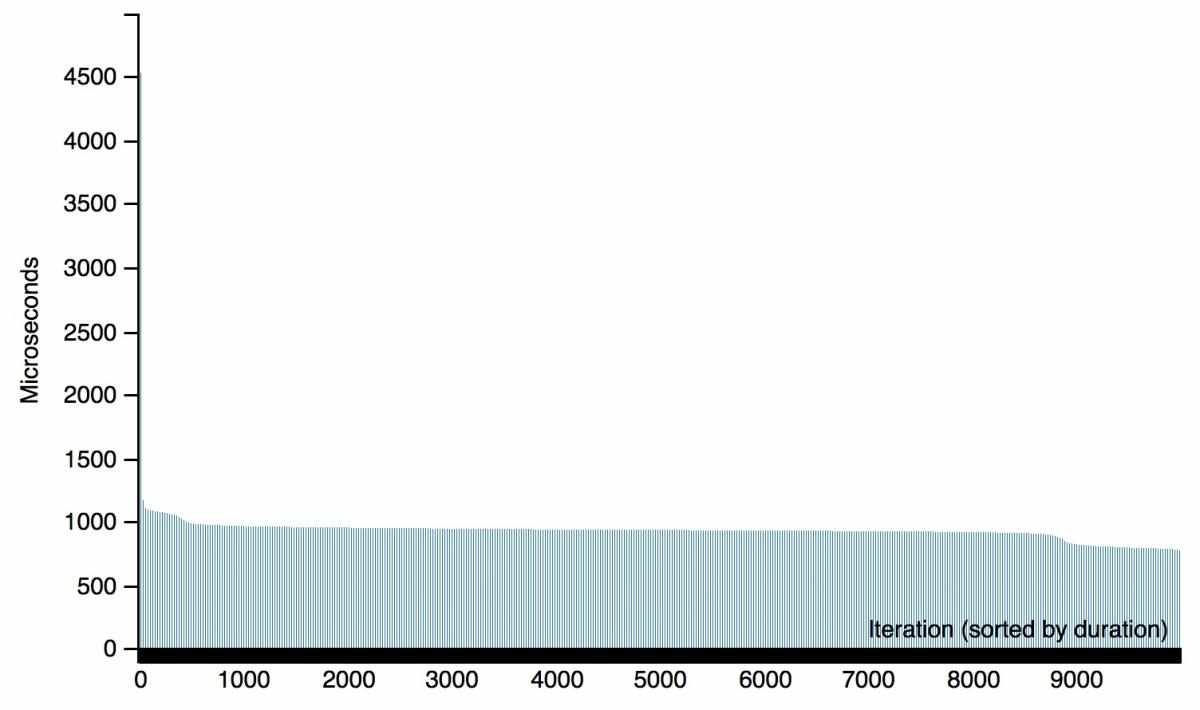
Direct Ethernet: For 10,000 iterations, with an average iteration of 0.929 ms, the longest 5 iterations were as follows:
-
4.530 ms
-
3.755 ms
-
3.395 ms
-
3.368 ms
-
2.952 ms
Most of the iterations were close to the average. This chart shows how long each iteration took:
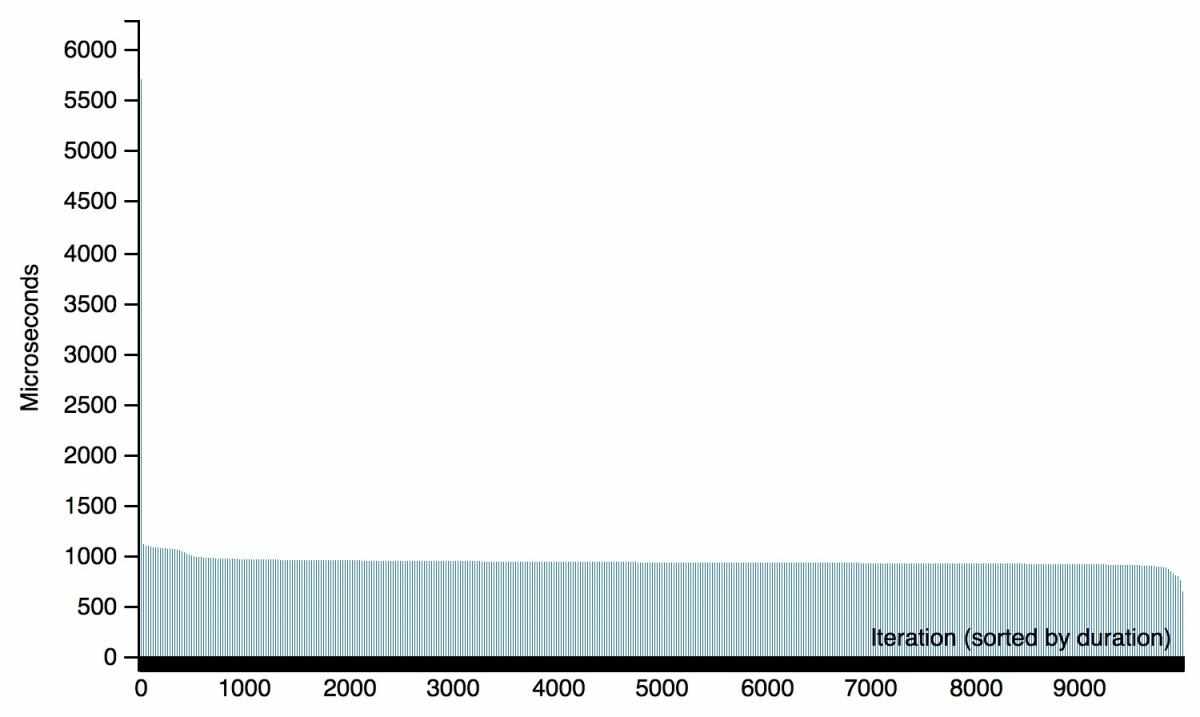
Ethernet: For 10,000 iterations, with an average iteration of 0.967 ms, the longest 5 iterations were as follows:
-
211.475 ms (omitted from the chart below)
-
12.045 ms (omitted from the chart below)
-
5.705 ms
-
3.379 ms
-
3.189 ms
Most of the iterations were close to the average. This chart shows how long each iteration took (the two highest iteration times are omitted):
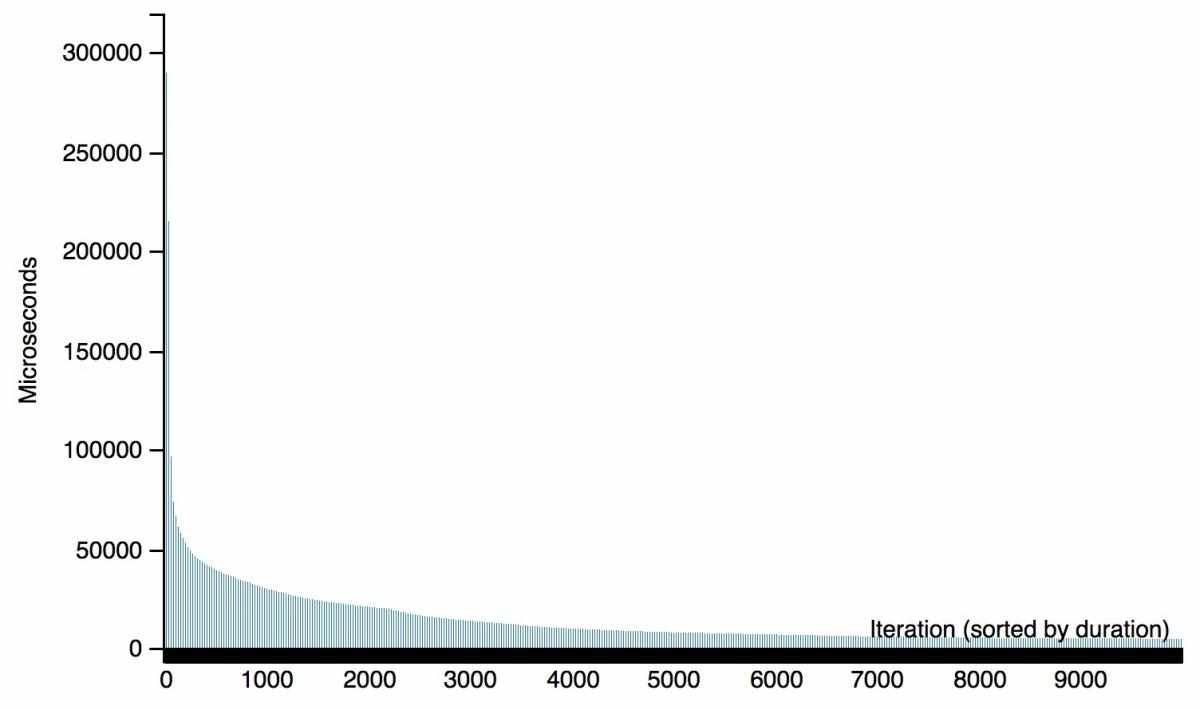
WiFi: For 10,000 iterations, with an average iteration of 14.376 ms, the longest 5 iterations were as follows:
-
289.969 ms
-
269.917 ms
-
267.039 ms
-
249.894 ms
-
249.425 ms
This chart shows how long each iteration took:
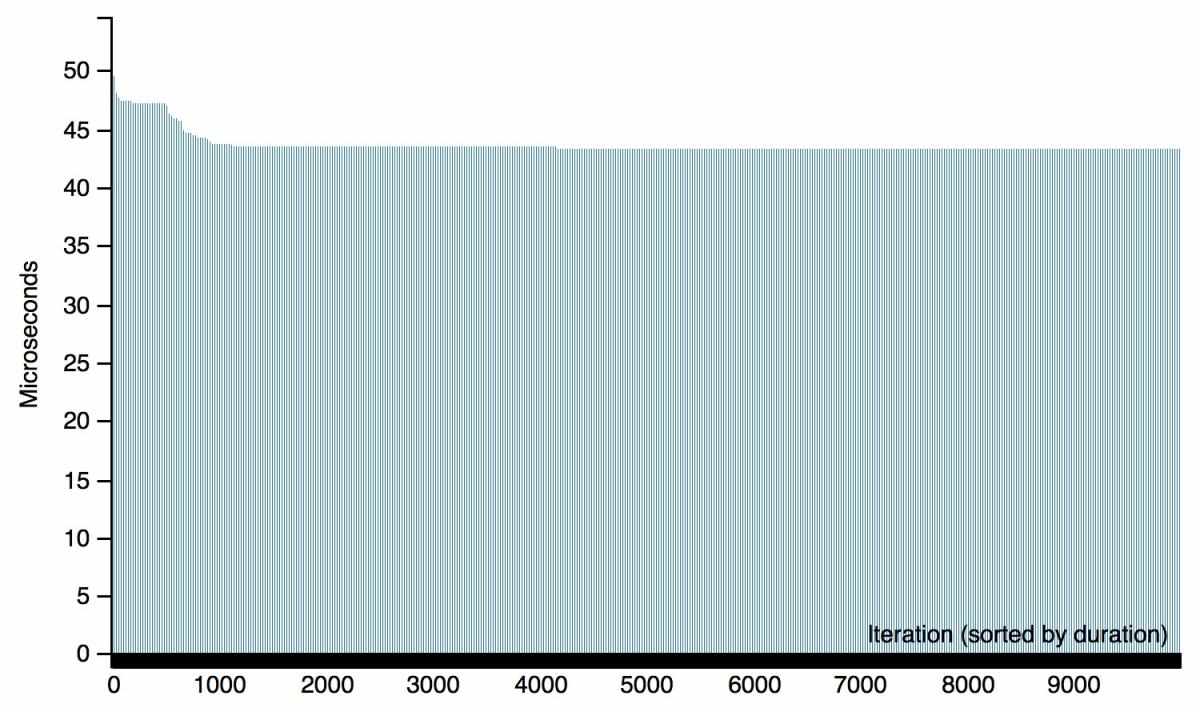
Lua Script: For 10,000 iterations, with an average iteration of 0.0436 ms, the longest 5 iterations were as follows:
-
0.0495 ms
-
0.0487 ms
-
0.0487 ms
-
0.0487 ms
-
0.0485 ms
Most of the iterations were close to the average. This chart shows how long each iteration took:
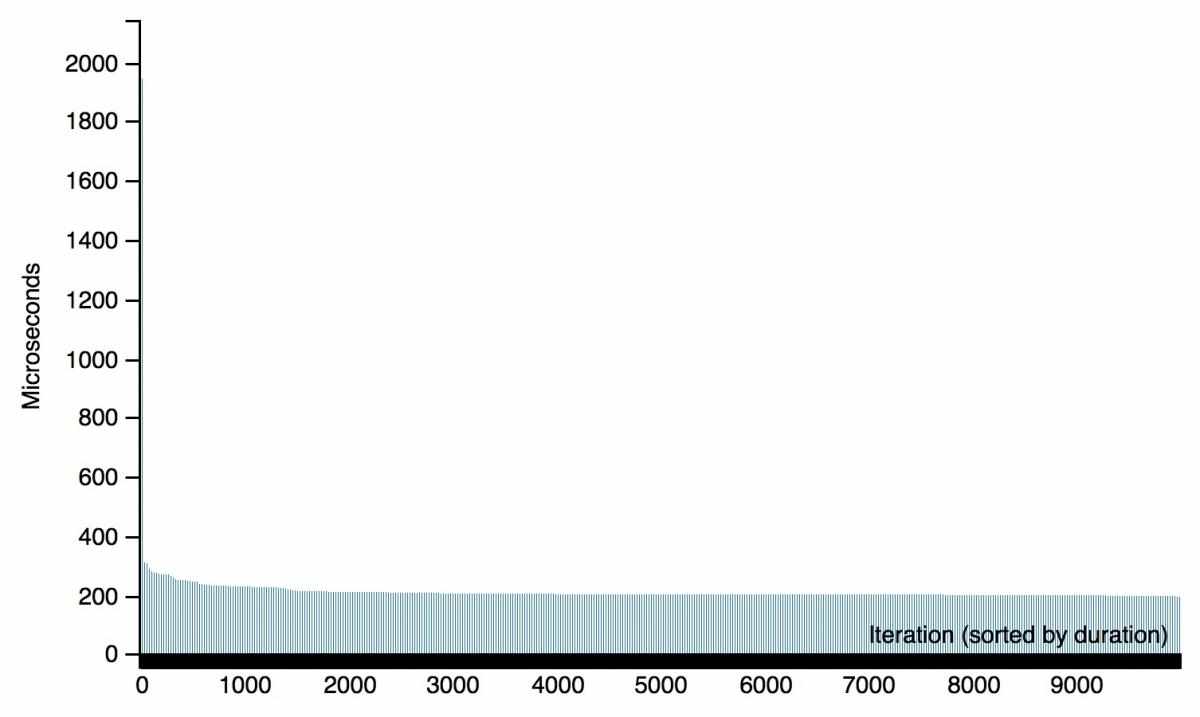
USB on the Raspberry Pi 4: For 10,000 iterations, with an average iteration of 0.210 ms, the longest 5 iterations were as follows:
-
1.944 ms
-
0.883 ms
-
0.792 ms
-
0.722 ms
-
0.545 ms
Most of the iterations were close to the average. This chart shows how long each iteration took:
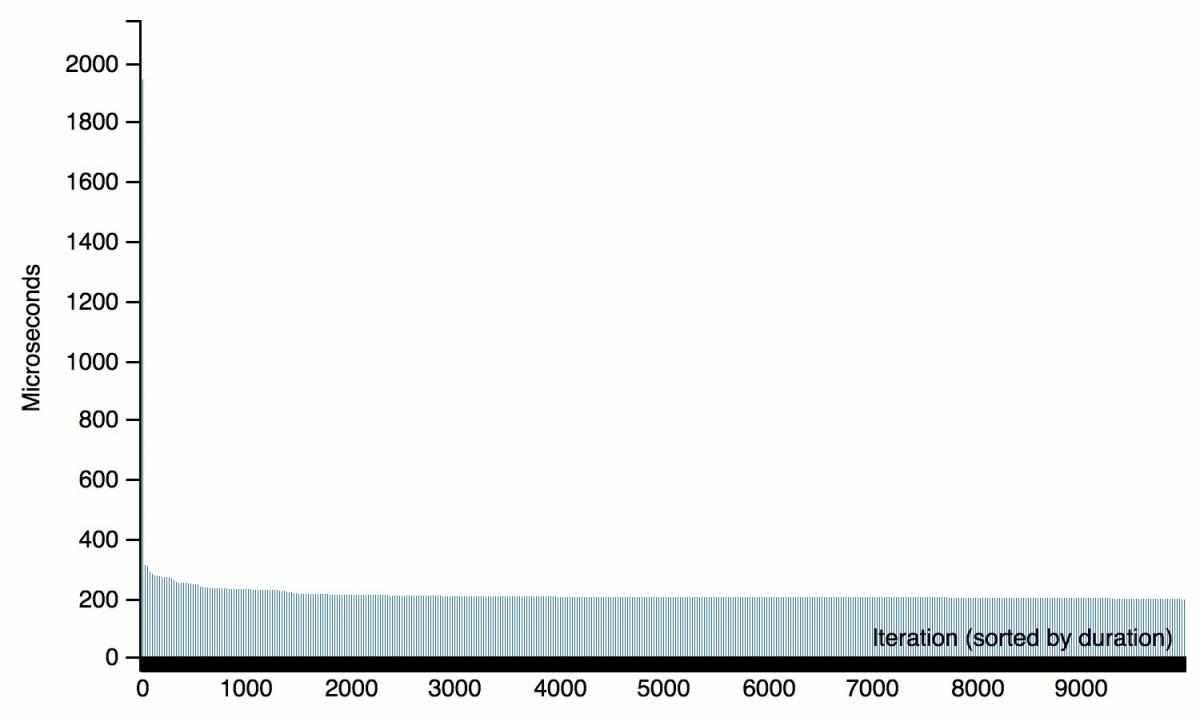
USB on the Raspberry Pi 3B v1.2: For 10,000 iterations, with an average iteration of 2.126 ms, the longest 5 iterations were as follows:
-
2.772 ms
-
2.740 ms
-
2.710 ms
-
2.708 ms
-
2.703 ms
Most of the iterations were close to the average. This chart shows how long each iteration took:
Determining What is Slow
There are a number of spots in your code that could be incurring a delay. These include:
-
Communication with a LabJack device
-
Communication with other devices
-
Other I/O
-
Graphics
-
CPU-intensive tasks
If your loop is too slow, try timing which part of your loop is slow. A good way to do this is to measure two sections: how long a section of code takes and how long the entire loop takes. Then, output both times and compare.
For T-series devices with LJM, see LJM_GetHostTick for a pseudocode example.
Example Speeds
Sample rates are dependent on many factors, so the best way to understand what speed your system is capable of is to test it yourself.
We collected maximum command-response sample rates which may not be representative of all systems.
See more\testing\c-r_speed_test.c (or the Windows executable more\testing\c-r_speed_test.exe) in the LJM examples for an example of how to measure benchmarks. There are also other speed tests examples in the LabVIEW examples and the Python examples.
System Under Test
The above tests were performed with the following:
-
Device: LabJack T7-Pro, firmware 1.028
-
Host computer (unless otherwise specified): i7-4510U 2.00 GHz processor, Ubuntu 18.04.3 LTS
-
USB 3.0 bus