LJLogM is a simple, ready-to-run executable that can acquire, graph, and log up to 96 channels of data from a single LabJack T-Series device. LJLogM is ideal for scan rates[1] less than 100 scans per second. Note: This documentation applies to LJLogM v1.14+.
Just starting? See our Device Quickstart Tutorials, then our LJLogM Basics Guide.
Supported devices
Download
LJLogM is included in the main LJM installation package.
The latest development version of LJLogM can be found at files.labjack.com.
The LJLogM (LabVIEW) source code is available in the LabVIEW_LJM archive.
Overview
LJLogM uses command-response mode communications, which works well at 100 scans per second or slower. See Section 3 and Appendix A-1 of the T-Series Datasheet for more information.
LJLogM vs. LJStreamM: LJLogM should be used instead of LJStreamM whenever possible. LJStreamM is only recommended when scan rates greater than 100 scans[1] per second are required. LJLogM uses command-response mode communications. It acquires and processes 1 scan at a time at the specified interval. LJStreamM uses stream mode acquisition. It retrieves and processes 0.5 seconds worth of scans every iteration. See Section 3 and Appendix A-1 of the T-Series Datasheet for more information.
LJLogM vs. LJLogUD: LJLogM supports T-Series devices. LJLogUD supports the U3, U6, and UE9.
Clearing Errors: Errors such as bad program settings can break the typical program execution. In most cases these errors can be cleared without exiting LJLogM by using the Program Config or Device Config panel.
-
Opening one of the configuration panels will clear the current error for the next program loop to run error free, however this would only resolve one-time errors.
-
Some device connection issues can be resolved by opening a new device connection using the
Device Configpanel. If you run into a device connection issue, try using the "ANY" connection options for every setting. This will attempt to open the first found LJM-compatible LabJack device that is visible to the computer. -
Bad program configurations can be cured by loading the default program config file
LJM_Default_Configs.cfgusing theProgram Configpanel.LJM_Default_Configs.cfgis saved to the current working directory each time LJLogM is opened.
See the “Default Configuration Files”, “Device Config Panel”, and “Program Config Panel” sections below for more information.
Device Configuration
Before logging data with LJLogM, the device needs to be set to the desired configuration. To configure the device, use Kipling to set and test any desired settings, then save the configuration to the device using the IO-Config Defaults tab.
For information about using Kipling, see here: Kipling
For information about saving settings, see here: Power Up Defaults
Default Configuration Files
LJLogM generates the following configuration files in the current working directory. None of these files should be modified outside of the program:
-
LJLogM.cfg: Contains logger program configurations such as
# Channels,Names, what channels to Graph, etc. This is a configuration file that the program loads on startup, and it is the file that program controls are saved to when you exit the program. -
LJLogM_open.cfg: Contains device open settings (DeviceType, ConnectionType, Identifier). This is a configuration file that the program loads on startup.
-
LJM_Default_Configs.cfg: Contains the default experiment configurations for
LJLogM.cfg. These are the configurations you would see when you load the program the first time. If there is some issue withLJLogM.cfgand you want to start from a known working configuration, load this file as your program configuration using the configuration button. -
LJLogM_register_list.cfg: Contains the list of registers loaded to the “Write Device Registers” section of the
Device Configpanel. This configuration file is written upon exiting theDevice Configpanel.
Startup and Shutdown Behavior
When the program is started, the configuration file LJLogM.cfg is read to determine the starting program configurations. If there is a problem loading the program configuration file, default configurations will be loaded. LJLogM_open.cfg is read to determine the starting LabJack device open configurations. Any errors that occur when trying to open a device connection will be displayed under Error Message. A new device connection can be made at any time using the Device Config button; see the “Device Config Panel” section below.
When you exit the program, the current program settings are saved to LJLogM.cfg and device open configurations are saved to LJLogM_open.cfg. These files are saved to the current working directory, which will also be loaded the next time LJLogM is opened.
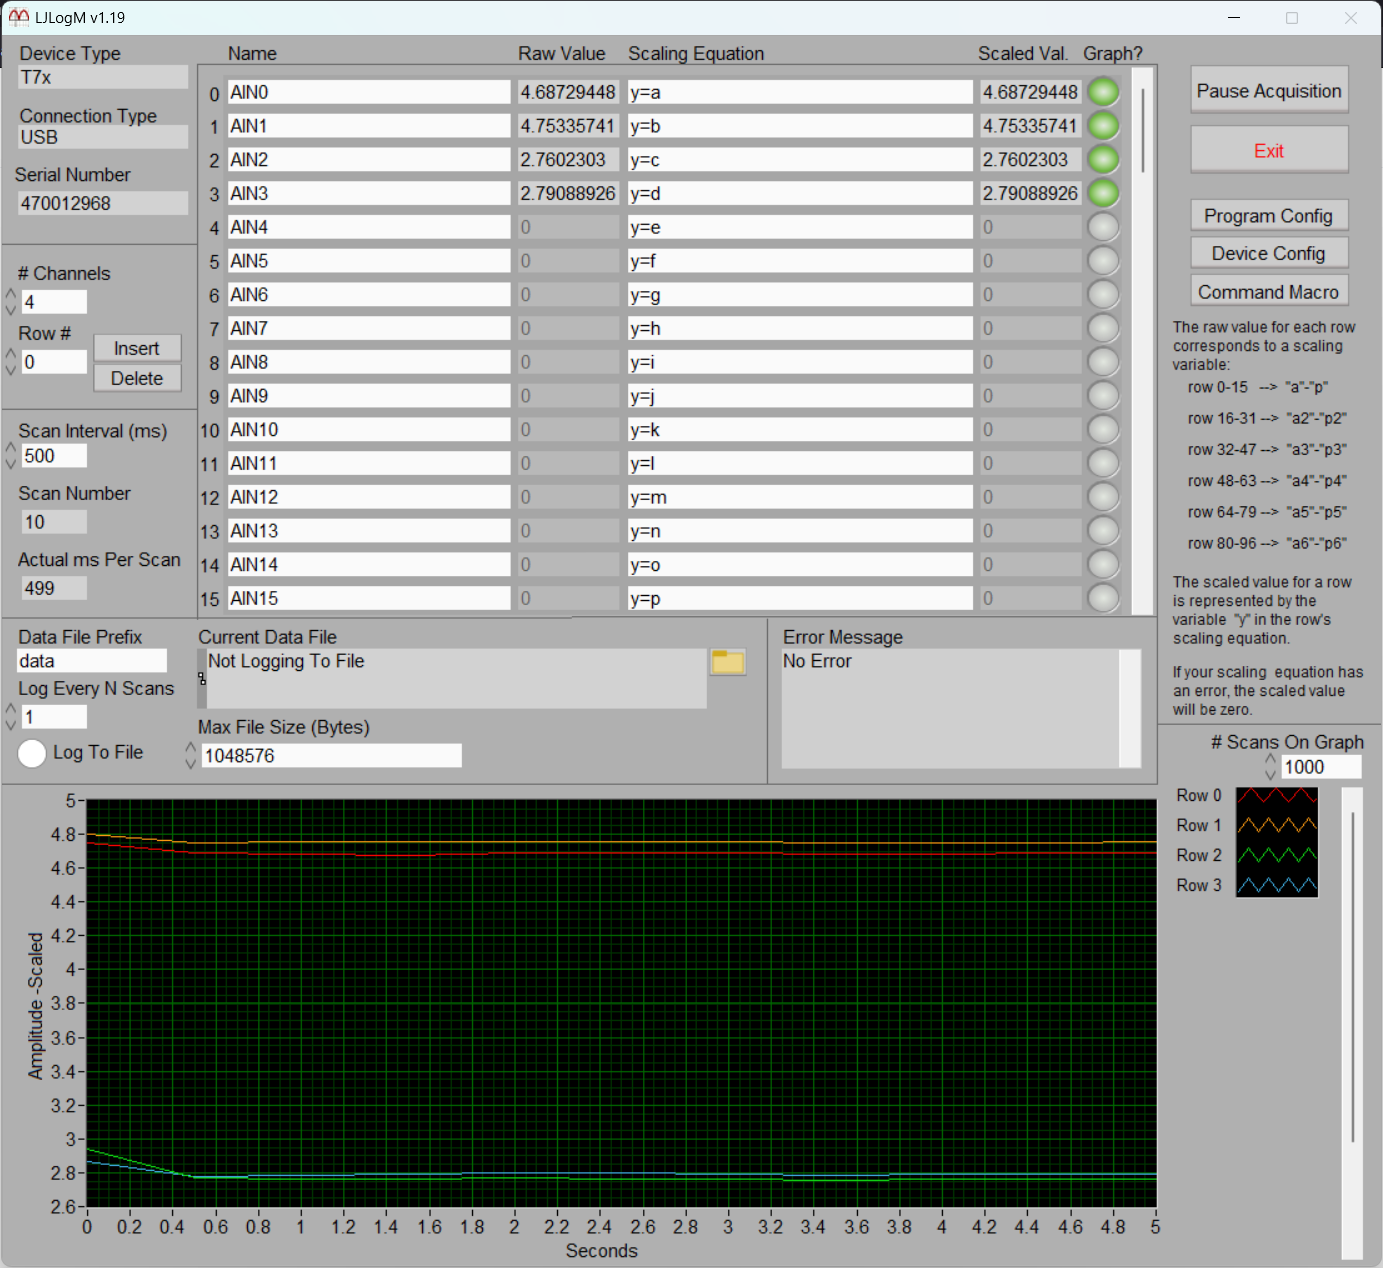
Control and Indicator Descriptions
Device Type, Connection Type, and SerialNumber (Opening): These indicators display information about the device connection that has been claimed by the program. By default, the program will open the first device connection it can find. To make a specific device connection, click the Device Config button then use the “Open a New Device Connection” options to make your desired connection. When you exit the Device Config panel and LJLogM, the connection options you chose will be loaded the next time LJLogM is opened.
# Channels: 1-96. Determines the number of rows/channels that will be measured. For example, row0, row1, and row2 will be active and measured if # Channels=3.
Row # (Insert/Delete): Insert or delete a row at the specified row number. Scaling equation variables are automatically shifted according to the insert/delete selection. Inserting a row number will pre-fill channel configurations with default values for the row Name, Scaling Equation, and Graph? values. See the Name, Scaling Equation, and Graph? descriptions below.
Scan Interval (ms), Actual ms Per Scan: Scan Interval (ms) is the time interval this program will attempt to complete a scan[1], update the screen, and log data to file (when logging is enabled). Note: It is possible for each logger iteration to take longer than the desired scan interval. The Actual ms Per Scan indicator describes the actual scan interval of the last iteration of the program. Use Tables A.1.2 and A.1.4 to estimate how long AIN samples will take.
Scan Number: The number of scan[1] iterations since the program was started or the configuration panel was used to select new configuration options.
Name: Specify the desired register Name for each row. For example, the first row defaults to AIN0, but it could be set to any readable register such as AIN9, EIO2, or WIFI_STATUS.
Raw Value: The value read from the register entered in the Name column for the row.
Scaling Equation: Scaling equation applied to the raw value for the row. The raw value for each row is mapped to a variable as follows:
row 0-15 → "a"-"p"
row 16-31 → "a2"-"p2"
row 32-47 → "a3"-"p3"
row 48-63 → "a4"-"p4"
row 64-79 → "a5"-"p5"
row 80-96 → "a6"-"p6"
For example, the default scaling equation for row0 is y=a, where y represents the scaled output value and a is a variable representing the raw value of the row.
Everything in the scaling equation after the characters // is ignored if you want to add comments. Examples:
y=c // Scaled value equal to raw value from 3rd row
y=100*c // EI-1034/LM34 voltage to deg F
y=c-273.15 // deg K to deg C
y=((c-273.15)*9/5)+32 // deg K to deg F
y=TCVoltsToTemp[K:c:a] // Type K, t/c voltage from 3rd row, CJ temp from 1st row
For more details see the LJLog/Stream Scaling Equations page.
Scaled Value: The value calculated from the scaling equation for the row. See Scaling Equation above.
Graph?: Determines whether the channel is graphed. The channel is graphed if the Graph? button is selected (lit up green) and the row is active according to the # Channels value.
Note: graphing many channels and using a large # Scans on Graph configuration can reduce performance and limit the program scan interval[1]. Limit the number of channels graphed to <20 or limit # Scans on Graph to help avoid these complications.
Data File Prefix: The program uses this as the base string when it makes a file name. When the program starts a new file, it appends a “_#” to the specified prefix, where "#" is the first unused number from 0-99999. For example, the default value for Data File Prefix is “data”. The first log file in an empty working directory would be named ‘data_0.dat’, the second log file would be named "data_1.dat", etc.
Log Every N Scans: When Log to File is selected, data will be logged every Scan Number that is a multiple of the Log Every N Scans value. For example, if Log Every N Scans=3 data will be logged every three scan intervals[1].
Log To File: When this button is selected, data will be logged to file. Certain controls such as # Channels are disabled when Log to File is enabled. Data is saved to tab-delimited ASCII-encoded files with a .dat extension. To quickly open log files in Excel or Open Office Calc, change the extension to .xls or .ods. To import the file to a Google Spreadsheet, change the extension to .tsv before uploading.
At the top of the log file is a human readable system timestamp of when Log To File was enabled.
The first data column in the file is a timestamp of seconds since midnight January 1st (Universal Time), 1904. This timestamp is generated from the host computer, not the LabJack device. For more information about presenting this timestamp in Microsoft Excel or Open Office Calc, see the LJLogUD & LJLogM Timestamps page.
After the timestamp column are columns containing “raw” register readings for each active channel followed by columns containing the scaled values for each active channel. Both raw and scaled values will be logged even if scaled = raw. For example if # Channels = 2, a line of data in the log file would look similar to the following:
Timestamp Raw0 Raw1 Scaled0 Scaled1
Note: LJLogM versions 1.15 and earlier only log the scaled values, not “raw” register readings.
Each row of logged data requires roughly 18 bytes for the timestamp plus 11 bytes per channel. If you log 8 channels, once per second for 60 seconds, you could expect a file size of approximately (18 + 11*8) * 60 = 6360 bytes. A 1 TB hard drive could hold a few hundreds of years of this data.
Max File Size (Bytes): When the current data file exceeds this limit, the file is closed and a new file is started. See the Data File Prefix description above for information on file naming conventions.
Current Data File: This indicator shows the path to the current file that data is being written to. When log to file is not active, this indicator will say ‘Not Logging To File’. To the right of this indicator is a small folder icon that will open a Windows File Explorer window at the current working directory.
Command Macro: This button will perform its set of pre-configured register operations. If an error occurs when performing register operations, a pop-up window will display the error message. Action register operations are configured in the Program Config panel. See the “Program Config Panel” section for more information.
Note: The Command Macro button was first added in LJLogM 1.17 and it was initially called the Action button.
Error Message: This indicator shows any errors that occurred in the most recent program iteration. Error messages will be displayed if there are LJM, Modbus, or scaling equation errors. If there are both LJM or Modbus errors, and scaling equation errors, only the LJM or Modbus error message will be displayed. LJM and Modbus errors should be resolved as soon as possible. Note: when a scaling equation error occurs, the scaled value indicator for the channel will be set to zero.
Pause Acquisition: This control will stop data acquisition until the Start Acquisition button is pressed. No new register readings will be acquired, the graph will stop updating, and data logging will be paused. The Row # (Insert/Delete) control will not apply changes until data acquisition resumes. All other functionality will operate normally.
Note: This control was first added in LJLogM 1.16.
Exit: This control will exit the program. It is the only way the program should be exited to ensure that device connection resources are released and configurations are saved properly.
Program Config: The Program Config button opens a panel with program configuration options. See the “Program Config Panel” section for more information.
Device Config: The Device Config button opens a panel with device configuration options. See the “Device Config Panel” section below for more information.
# Scans on Graph: Controls how many scans[1] are shown on the graph. For example, if you set this value to 120 and you acquire 2 scans/second (a scan interval of 500ms) the graph will show 60 seconds of data. The graph is similar to a strip chart, and it displays the last n scans. To clear the graph, change any entry in the Graph? array of buttons.
Program Config Panel
The program config panel has controls to change the program working directory and save or load program configurations from file. The panel can be opened by clicking the Program Config button near the center-right of the main program window. Note: opening the panel stops channel acquisition and logging until the panel is closed.
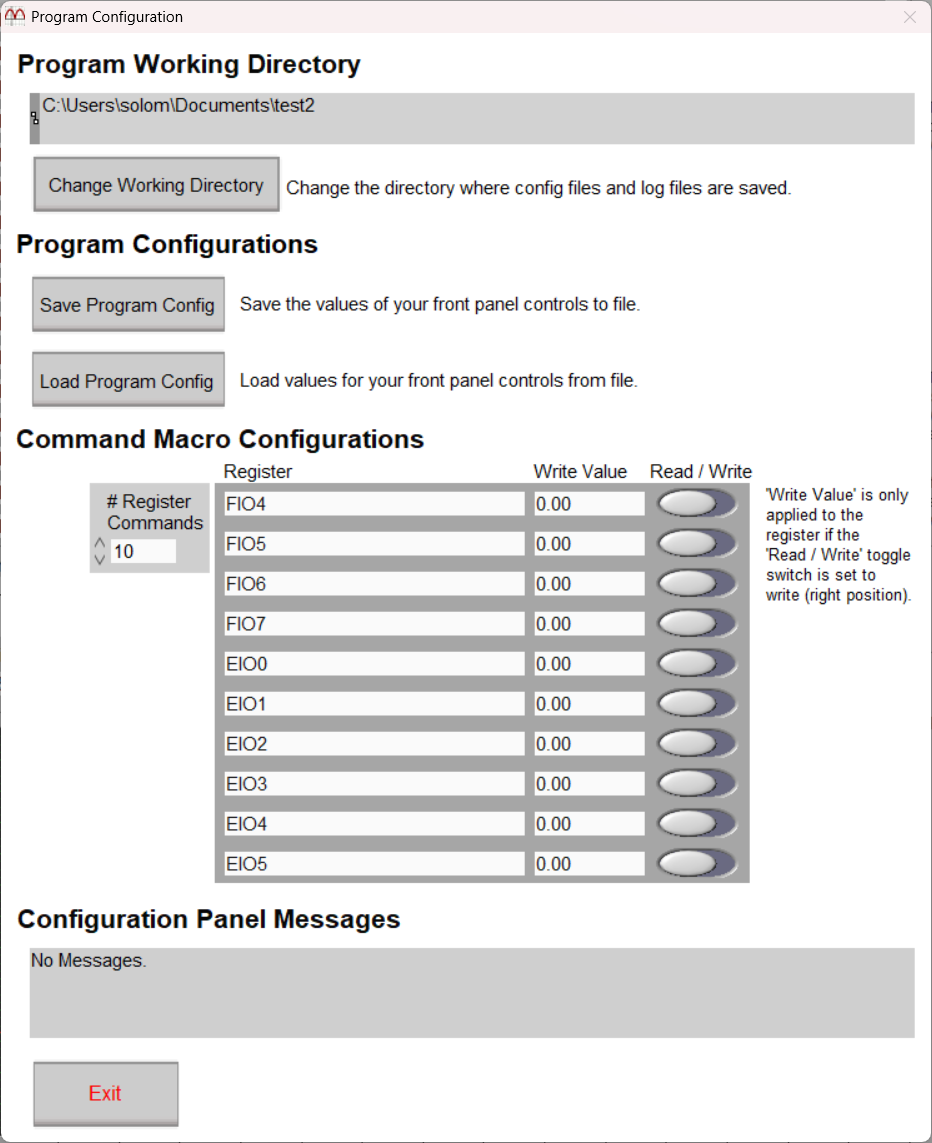
Program Working Directory: The “Program Working Directory” section displays the current working directory for the program. This determines the location of the program configuration file and where log files are saved.
The Change Working Directory button can be used to change the current working directory where program configuration files and log files are saved. After navigating to the desired directory in the pop-up window, click Select Cur Dir at the bottom-right. For more details see the LJLog/Stream Working Directory page.
Program Configurations: The “Program Configurations” section allows you to save the current program configuration to file or load a configuration from an existing program configuration file. New program configuration files are saved to the current working directory; see the “Program Working Directory” section. Program configuration files save the following program controls: # Channels, Scan Interval (ms), Name (for every row), Scaling Equation (for every row), Graph? (for every row), Data File Prefix, Log Every N Scans, Log to File, Max File Size (Bytes), # Scans on Graph, and all Command Macro configurations.
Command Macro Configurations: The “Command Macro Configurations” section defines the register operations performed by the Command Macro button in the main program window. The # Register Commands control sets how many registers will be accessed when the Command Macro button is pressed. Up to 10 registers can be written or read. The left position of any Read / Write switch will set the associated register to read, and the right position to write. The Write Value configuration does nothing if the register is set to read. When a register is set to read, the value read upon pressing the Command Macro button is immediately discarded; the main purpose of the read option is to reset certain features such as reading a DIO#_EF_READ_A_AND_RESET register to reset a DIO_EF.
Note: The Command Macro button was first added in LJLogM 1.17 and it was initially called the Action button.
Configuration Panel Messages: Any errors that occur while attempting to make changes in the configuration panel will be displayed in the “Configuration Panel Messages” section. Messages are also displayed upon successful configuration changes.
Device Config Panel
The device config panel has controls to write device registers, open a new device connection, and save or load device startup settings. The panel can be opened by clicking the Device Config button near the center-right of the main program window. Note: opening the panel stops channel acquisition and logging until the panel is closed.
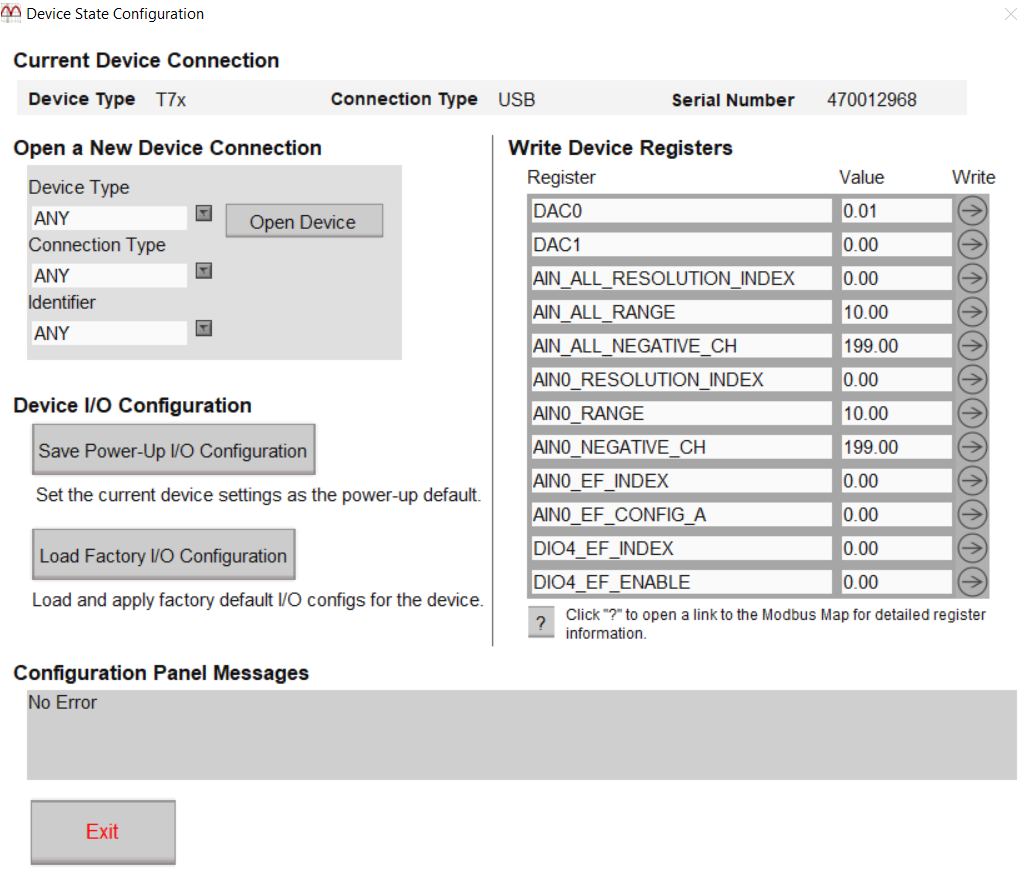
Current Device Connection: The “Current Device Connection” section describes the device connection currently claimed by the program.
Open a New Device Connection: The “Open a New Device Connection” section can be used to open a different device connection. Change each of the Device Type, Connection Type, and Identifier fields then click Open Device to attempt to open a new device connection. If the connection fails, an error message will be displayed and the previous device connection will be reestablished as long as the connection is still valid. If you successfully open a new device connection, the device open parameters will be saved to LJLogM_open.cfg upon closing the program.
Write Device Registers: The “Write Device Registers” section allows you to write device registers without closing the program. Upon opening the configuration panel, the registers displayed in the ‘Registers’ column are read, and their values are displayed in the ‘Value’ column. When a register in the list is not readable, the value displayed will be zero. To change the value of a register, change any entry in the ‘Registers’ column to your desired register name, change the corresponding ‘Values’ entry to the desired register value, then click the corresponding ‘Write’ button. Note: the device register write functionality is meant for testing purposes and Kipling is recommended for most changes to device I/O configurations.
Device I/O Configuration: The “Device I/O Configuration” section features two buttons to save or load Device Configurations on the LabJack device. See the Device Configuration section of the T-Series Datasheet for more information about Device Configuration.
Configuration Panel Messages: Any errors that occur while attempting to make changes in the panel will be displayed in the “Configuration Panel Messages” section. Messages are also displayed upon successful configuration changes.
Revision History
1.19: Change'Program Config', 'Device Config', and 'Command Macro' buttons back to normal text buttons. Moved these buttons directly under the 'Exit' button. Added errors to conditional error clear functionality.
1.18: Changed the 'Action' button to 'Command Macro'. Disabled the plot legend controls. Fixed an issue with visual artifacts that sometimes occurred when the scroll wheel and mouse cursor were moved at the same time.
1.17: Added an action button that can read and write registers on the fly.
1.16: Changed the loggers to use a constant 500ms interval when an error occurs. The device config color toggle on open error functionality with now blink at a constant 500ms interval. The scan number will now only increment if there is no error. The scan number now persists if the user opens the ‘Program Config’ or ‘Device Config’ windows. Added a ‘Pause Acquisition’ button. Added raw value readings to log files. Added functionality to disable the front panel scrollbars if the user display is bigger than the front panel window.
1.15: Updated loggers to tie plot color to row number, and to use the row numbers (f.e. Row0) as the plot names in the plot legend. Added a scrollbar to the plot legend.
1.14: Fixed an issue where very small readings were being displayed with scientific notation. Updated the folder boolean button so it looks more like a button. Split the Configuration panel into "Device Config" and "Program Config" panels. Updated the GUI for the two new config panels so their style is similar to Kipling. Fixed a bug where clicking the "Save Program Config" button displays a "saved config" message instead of a cancellation message when the cancel button is pressed. Fixed a bug where clicking the "Load Program Config" button then cancel returns a bad config message. Added messages to the program config panel when the "Change Working Directory" button is pressed. Changed the current device connection to display "Opening..." while the connection is being made (after pressing the open new connection button or during the logger program initialization). Changed the "currently open device" strings to display "Not connected" on error. Limit logger string fields such as the scaling equations to a single line. Removed pop-ups that would trigger if the initial device open fails. Instead there is a message to go to the device config panel to open a new connection in the error message. Disabled window close in logger sub-panels. Shrunk logger windows slightly to better fit 1080p displays. Added a color toggle to the "Device Config" button so it is emphasized on device open errors. Fixed a bug where controls were not disabled properly when log to file is enabled at startup.
1.13: Added a button to open the current working directory in Windows File Explorer. Update logger GUIs. Change default logger graph precision to 9 digits.
1.12: If a program config file does not exist, load the defaults without warning the user. Rearranged logger graph palettes on the front panel.
1.11: Made minor Visual tweaks to the front panel. Made optimizations to scaling equation processing and front panel responsiveness.
1.10: Reworked configuration file handling, including adding the configuration panel. Moved the "Change Working Directory" button to the configuration panel. Refactored the write to file functionality. Added scaling equation error messaging. Renamed the "experiment" configuration file to "program" configuration file. Added register write functionality to the configuration panel. Increased front panel text size, changed font to Arial (monospace), and set the minimum panel size. Added support for 96 channels. Added the "Log Every n Scans" control. Added row modification controls. Note: a program configuration file with 96 channels from LJLogM v1.10 would not be recognized as a valid configuration file in v1.09.
1.09: Fixed SignedMSWLSW scaling equation functionality. This was previously returning an unsigned 32-bit integer representation. It now returns a signed 32-bit integer representation.
1.08: Made change so that Inf values are assessed as 0 when used in scaling equations. This fixes an issue related to processing Inf values in scaling equations. Added error handling to recover from LJME_INVALID_NAME gracefully. Made a change to allow use of the LabVIEW graph palette (for advanced users only). When set to visible, the palette will be in the bottom right corner of the LJLogM graph.
1.07: Updated buttons to load new configurations. Added factory setting config files (LJM_Default_Configs.cfg and LJM_Open_Any.cfg). Fixed LJLogM channel index text size. Updated error handling. Changed TCVoltsToTemp error behavior from outputting 0.00 to 9999. Fixed the front panel (the device parameters were misplaced). Fixed minor path resolution bug.
1.06: Added configuration selection and save options.
1.05: Set minimum value of #Channels to 1. Fixed problem where name of the exe was not detected properly. Fixed issue where you could never decrease the number of channels shown on graph. Changed version check sub-vi so it only shows prompt when new version available, not on version check errors. Changed scaling sub-VIs to use LJM thermocouple function rather than LJUD function.
1.04: Skipped version number.
1.03: Added support for SignedLSWMSW[lsw:msw] function in scaling equations to handle quadrature reads. For efficiency, scaling equations now skipped if no scaling is needed (e.g. y=a).
1.02: Changed all text to Segoe UI font so screen items are aligned regardless of system font size. Changed to show scroll bars.
1.01: Changed to use this application's filename (w/o extension) to create the names of the config files and registry entry. Added "Write To File" control to items saved in config file, so the application will now remember how this control was last set.
1.00: First version.
[1] A scan consists of one sample from every channel in a scan list. As it relates to LJLogM, a scan would consist of a sample from every register name (up to # Channels registers) in the Name column.