This app note provides a detailed overview for using LabJack devices with bridge circuits. If you are using a raw bridge sensor/load cell/strain gauge that is ratiometric (mV/V) and are simply looking for guidance on which products to use, we suggest using a LabJack T7 and LJTick-VRef41 for the best measurements and ease of use.
A Wheatstone bridge is a circuit used to measure small differences in resistance. Such bridge circuits are common with various types of sensors such as load cells, pressure sensors, and strain gauges. These sensors can be packaged with signal conditioning or as raw bridge circuits; this app note applies to sensors that are not packaged with signal conditioning.
Subsections
Common Bridge Circuit Sensors
Strain Gauge
A strain gauge (or gage) is a resistive element whose resistance changes with strain. The change in resistance is small, so a bridge circuit is commonly used for measurement. Look for signal-conditioning hardware that includes bridge completion, or complete the bridge yourself. See the setup and calculation information in our Strain Gauges App Note.
Load Cell
Most load cells are raw bridge circuits without signal conditioning. If the output is specified as something like 2 mV/V, it is a raw bridge circuit. If the output is specified as something high-level like 0-5 volts, ±10 volts, or 4-20 mA, then the load cell has signal conditioning and this app note does not apply.
A nice option for hobbyist/entry-level users to start working with load cells is this sensor offered by Sparkfun.
Pressure Sensor
Some pressure sensors are raw bridge circuits and, like load cells, would specify an output such as 2 mV/V. See the Pressure Sensors App Note for more details.
Bridge Circuit Hardware Solutions
U6, T7, T8
These devices can acquire small differential bridge signals directly using their built-in amplication. Note that the high gain required for the measurements reduces the maximum T7 and U6 sampling rates when sampling multiple channels at once. See Section 3 of the U6 Datasheet or Appendix A-1 of the T-Series Datasheet. The LJTick-InAmp can be used in place of the built in amplification to avoid these sampling rate limitations. Also note that these limitations do not apply to the T8.
U3, T4
The U3 and T4 do not have high enough resolution for unamplified bridge circuit measurements, they do not have built in amplification, and some IO cannot take differential measurements directly. As such, these devices require external signal-conditioning such as the LJTick-InAmp to take measurements from bridge circuits.
LJTick-InAmp
The LJTick-InAmp (LJTIA) is an external per-channel instrumentation amplifier add-on. An LJTick-InAmp or similar difference amplifier is required for bridge measurements with the U3 and T4. The LJTick-InAmp is seldom used with devices that have built-in amplification since the built-in amplification of devices such as the U6, T7, and T8 is superior in terms of noise, resolution, and accuracy. The following are some reasons to add LJTick-InAmps to the U6/T7:
-
When using the internal amp with Gain >1, acquisition speed decreases substantially when scanning more than 1 channel. A per-channel amp such as the LJTick-InAmp is the solution to this.
-
The LJTick-InAmp can be used in addition to the internal amp to stack the gains and get extremely high amplification. Noise is also amplified, so it is not guaranteed that this technique will result in a superior signal-to-noise ratio.
Basic Procedure for Bridge Circuit Measurement
These are the most common steps used to set up bridge circuit measurements with LabJack devices. Be sure to see the corresponding procedure sections that follow.
-
Choose an Excitation Source.
-
Wire your Bridge Circuit to the Appropriate Analog Input(s) and Excitation Source.
-
Find the Required Equation to Convert Voltage Readings to the Load Quantity.
-
Configure your LabJack with any Required Analog Input Settings, Do Basic Testing To Validate the Signal and Connections.
-
Troubleshoot the Signal Voltage Measurement if Incorrect or Too Noisy.
-
Log Data with LJLogUD/LJLogM.
Excitation Voltage Supply Selection
The output of a bridge circuit is directly proportional to the excitation voltage. As a result, any noise in the power supply could show up as noise in the signal output and measurement.
Many load cells and strain gauges recommend 10 volts for the excitation voltage. This might be where the manufacturer calibrated the sensor, but the sensor output will scale linearly with any excitation voltage. A maximum excitation voltage is often specified (15 volts is typical) but generally no minimum voltage is specified. Using normal load cells with lower excitation voltages such as 2.5 or 4.1 volts is fine. 2.5V and 4.1V reference voltage sources often provide superior performance to regular DC power supplies.
Feedback
It is typically recommended to use feedback to measure the actual value of the excitation voltage in real-time. 16-bit or higher analog inputs are better (more accurate and more stable) than all but extremely expensive excitation sources and will work for feedback from common sources. Make a connection from Vexc+ to an AIN terminal and take a measurement whenever you take a measurement of the bridge signal.
Wiring for Raw Bridge Measurements
Most load cells with raw bridge outputs are packaged as a full bridge circuit, simplifying the sensor setup compared to quarter or half bridge circuits. Strain gauges require bridge completion before measurements can be made; refer to the Strain Gauges App Note for specific suggestions.
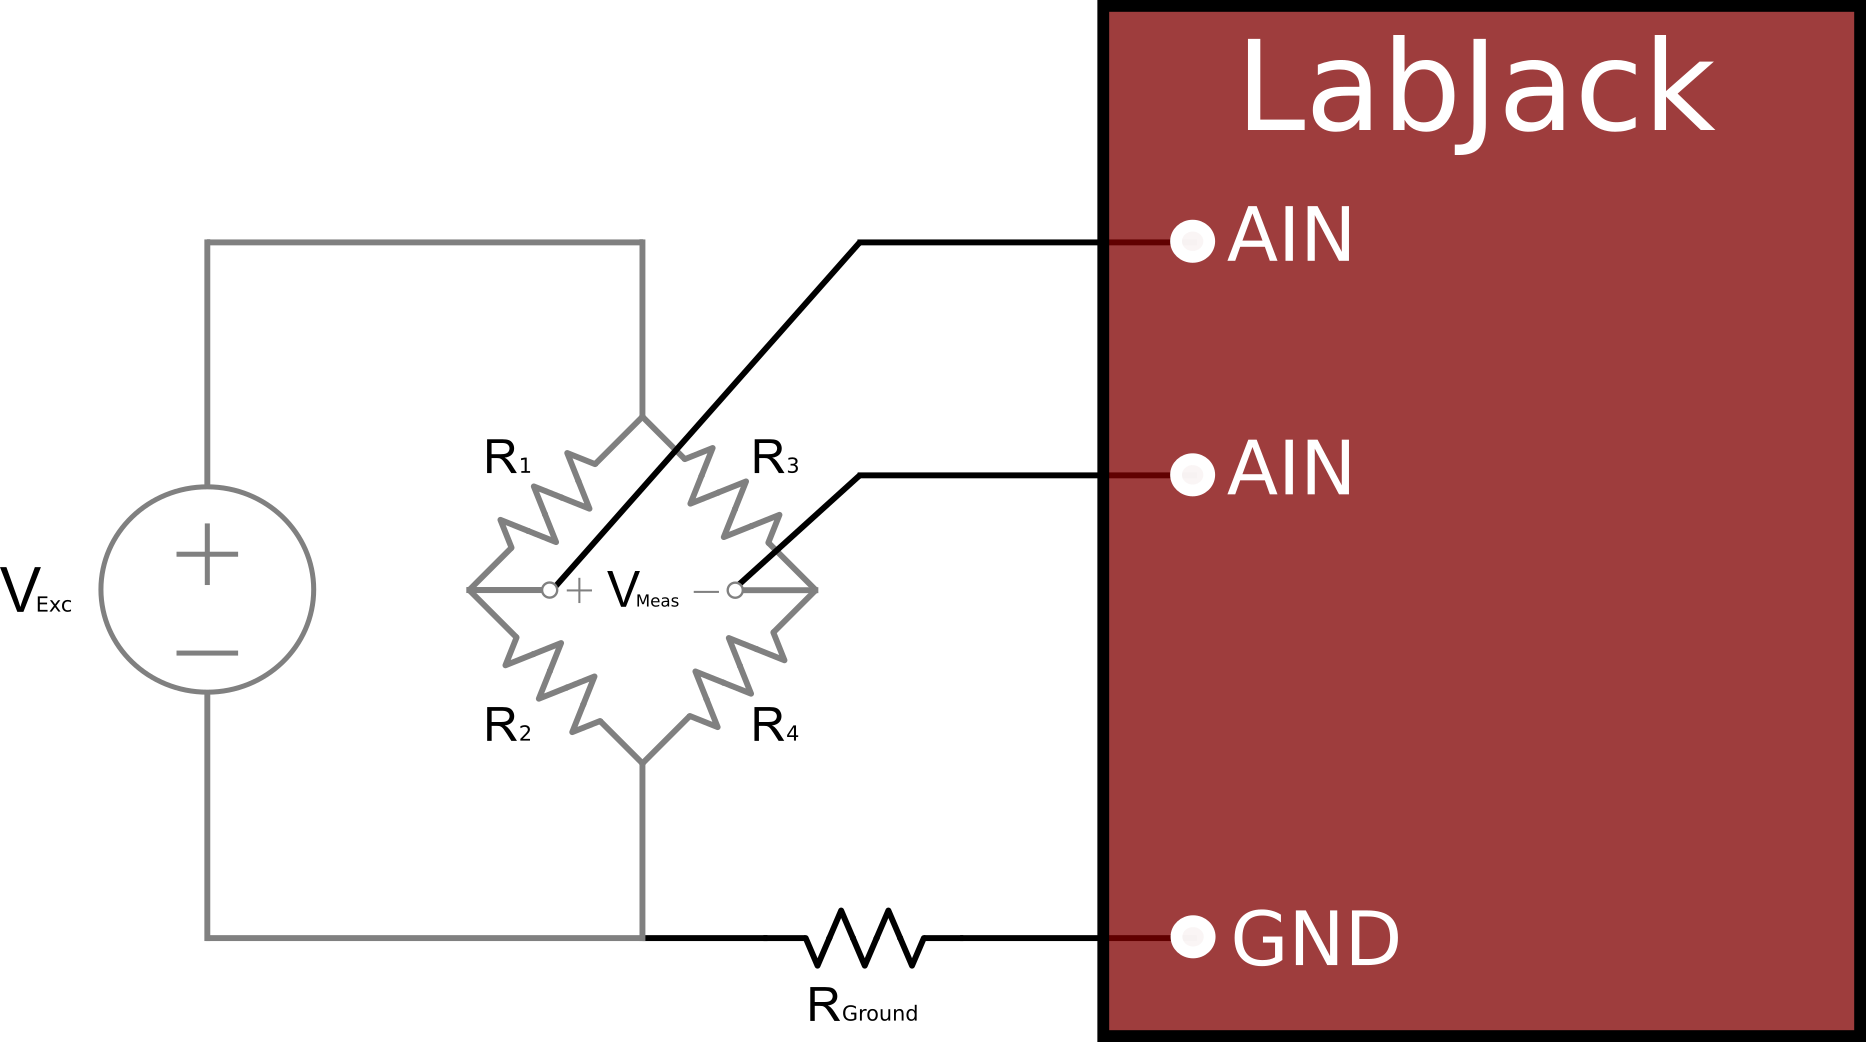
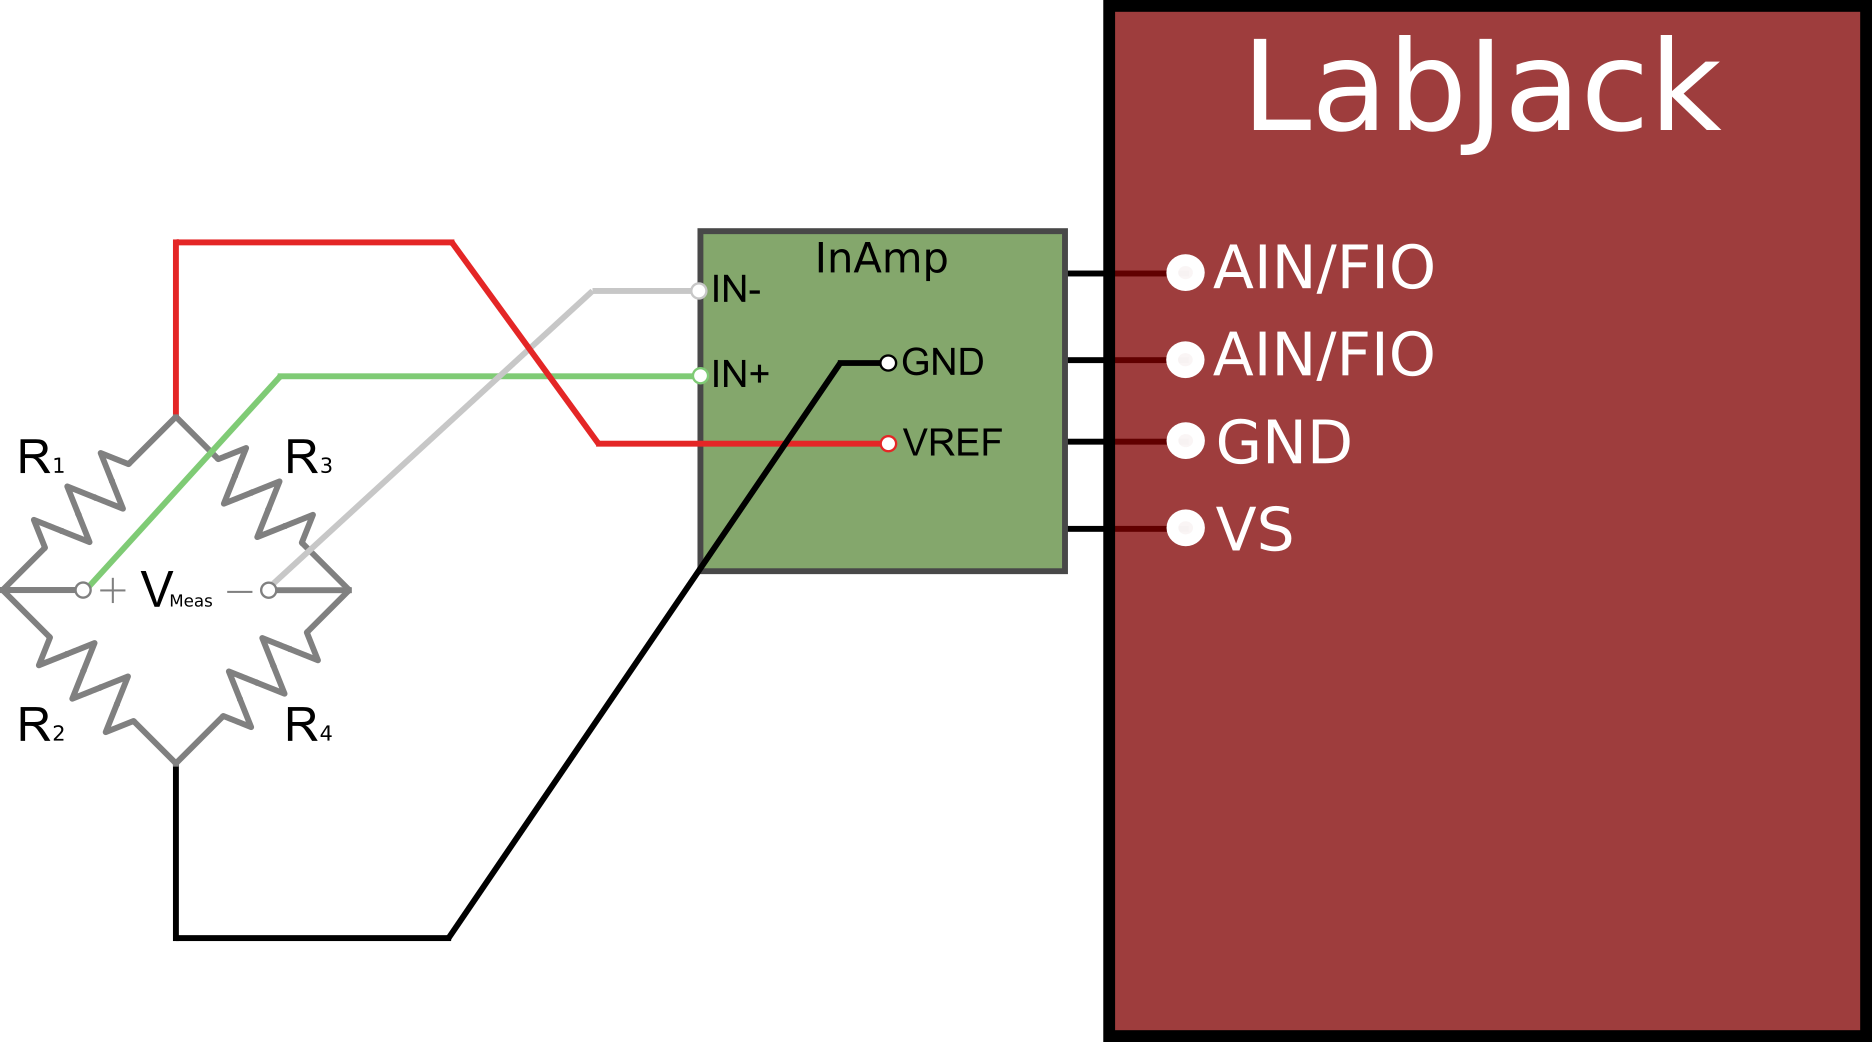
The best connections for your situation can vary, but generally we suggest using the built-in amplification on your device if supported (T7/U6/T8) or the LJTick-InAmp otherwise (T4/U3). Your load cell should be wired similar to one of the following figures.
Scaling Equations
Strain Gauges
See our Strain Gauges App Note for detailed scaling equation information.
Load Cells
Raw bridge load cells should come with a specification for sensitivity. A common sensitivity value is 2 mV/V. The relationship between voltage output and load should be linear, and also directly proportional to the excitation supply voltage. The signal output in volts at 100% rated load will be Sensitivity * Vexc. We can find the equation to solve for any load given the measured voltage Vmeas:
Load = RatedLoad * Vmeas/ (Sensitivity * Vexc)
Extra InAmp Considerations
When using an LJTick-InAmp, the measured voltage on a LabJack AIN is not the same as the voltage out of the bridge circuit, and an additional scaling equation is required to convert VAIN back to Vmeas. VAIN is what is measured from the LabJack AIN, Voffset is the offset voltage applied from the InAmp, gain is the gain setting of the InAmp, and Vmeas is the output of the bridge circuit as seen in Figures 1 and 2 above:
Vmeas = (VAIN- Voffset) / gain
From here, you would plug in the above equation for Vmeas in the appropriate scaling equation.
Load Cell Example
Consider the scaling equation for a load cell:
Load = RatedLoad * Vmeas/ (Sensitivity * Vexc)
If you have an LJTick-InAmp for conditioning, an offset and gain is applied to the signal. Using the InAmp conversion equation above, we get the following load equation:
Load = RatedLoad *(VAIN- Voffset)/ (gain * Sensitivity * Vexc)
Performing a System Calibration
A system calibration is useful because it includes all sources of error and it can be used to abstract away some of the details from things like InAmp conditioning. If you can put the system in two known load conditions, you can get 2 pairs of points and fit a line to get a slope and offset:
Load = Slope * Vmeas + Offset
This is valid at the Vexc during the time of that calibration (Vexccal), so to make it valid with the real-time reading of Vexc you would write it as:
Load = [(Slope * Vmeas) + Offset] * Vexc/Vexccal
Note that both of these equations rely on 2 real-time readings: Vmeas and Vexc. See the related excitation source feedback section above.
LabJack Configuration and Basic Testing
We recommend using the highest gain/range setting on your device, choosing the gain/range setting according to the maximum output expected for your maximum load condition. We also recommend using the highest resolution index setting available on your device. These settings can be modified using our configuration software.
For information about available AIN settings, see your device datasheet:
Basic Testing
Put on a known load, and confirm that you get the expected output from the bridge. See the scaling equations section above to help relate voltage readings to a load measurement.
For example, say you have a load cell that specifies 2 mV/V sensitivity. The output at 100% rated load is Vexc * 0.002, so if we measure Vexc as 3.5 V and are at 50% load we expect an output of 0.0035 V. At rated (100%) load, which should also be the maximum voltage output, we would expect to see 0.007 V.
Troubleshooting
Generally, an issue with a bridge circuit measurement can be contributed to an issue with:
-
The circuit wiring
-
The measurement configuration in software
-
The excitation source
-
The LabJack hardware (typically not the issue)
Wrong Value
Put a known load on the load cell and check the bridge voltages with a DMM. Measure from Vexc+ to Vexc- to confirm the excitation voltage. Measure from Vmeas+ to Vmeas- to confirm the signal voltage is as expected. This should help identify if the issue is with the excitation source or wiring.
If these tests return expected values, then the issue is likely a configuration problem in software. Go back through the configuration section above. If you still have issues from there, we suggest removing your bridge circuit and instead testing the LabJack hardware as described in our Test an AIN Channel App note.
Correct Average Value, but Too Noisy
Remove your bridge circuit and instead jumper both inputs to GND with short wires. Look at the noise level and compare to the expected levels for your device as described in the noise section of our Test an AIN Channel application note. If the noise level of the readings with your actual bridge signals connected are notably higher, the most likely culprit is the excitation voltage. You can reduce some of the effects of excitation voltage noise by taking real-time Vexc readings (feedback) in your scaling equation.
Logging Data with LJLogUD/LJLogM
On Windows, an easy way to view and log data is with LJLogUD (UD devices) or LJLogM (T-Series Devices).
LJLog(M/UD) Scaling Equations
Your scaling equation should be applied on the channel you are using to capture your measurement. If you follow the previous suggestions, you would modify the scaling equation of row 0.
You can reference any channel(s) in your equation using the corresponding row letter/variable. The raw voltage measured in row 0 is always stored in the variable a, the raw voltage in row 1 is always stored in variable b, row 2 in variable c, etc. all the way to row 15 whose raw voltage is stored in the variable p. In the LJLog(M/UD) setup above, Vmeas is measured in row 0 and Vexc is measured in row 1, so you would replace Vmeas from the scaling equation section above with a and Vexc with b.
-
The
Voltage/Valuecolumn will still report the raw measured voltage, but theScaledcolumn will report the measured load. -
The following page has additional information on LJLogUD/LJLogM scaling equations.
-
To start logging data to file, click the
Write To Filebutton.
Load Cell Example:
Say you have a load cell with a rated load of 300 kg and sensitivity of 2 mV/V. Your scaling equation to find the load in kg could be:
Load = 300 * Vmeas/ (0.002 * Vexc)
Assuming you set up row 0 to acquire Vmeas and row 1 to acquire Vexc, your scaling equation in LJLog(M/UD) would be:
y = 300 * a / (0.002 * b)
Other Software Options
For other software options, see the information in your device Quickstart Tutorial.


